Introduction
The main purpose of this lab activity was to help us familiarize ourselves with the TIMS unit and the tools we use with it. This TIMS unit is a bench top signals and systems device that is used to teach students about how the mathematical principles they have learned apply to electrical engineering practices. The unit can generate signals dictated by control software on a lab computer and these signals can then be manipulated using the benchtop modules and banana cables. Additionally, we learned analyze the signals we generate using the Pico scope digital oscilloscope and its corresponding control software.
Procedures
Part A: PC-MODULES CONTROLLER and Pico Scope
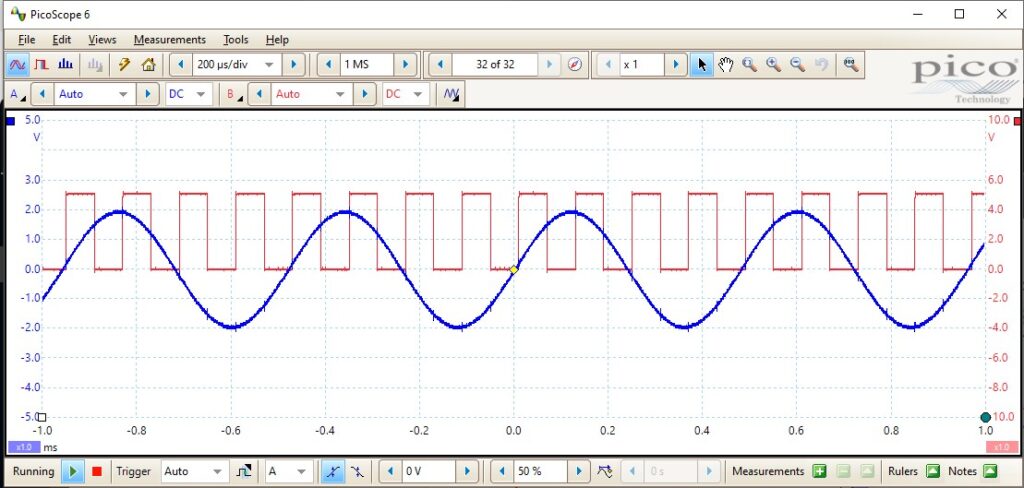
In steps 1 thru 4, we began by connecting the Pico Scope to the TIMS unit and reading the provided 8.3 kHz clock and 2kHz message signal at the same time in the Pico Scope software. This was done by connecting banana cables from the Master Signals module to the PC-BASED INSTRUMENTS INPUT, which connects them to the Pico Scope. On our workstation, we opened the PicoScope 6 software and experimented with the time scale which shrinks or stretches the graph. It is important to note at this point we are in scope mode with shows us signals over time as opposed to spectrum mode which shows us signals over frequency. We found that 200 us/div works best for this scenario. After the time scale was set, we enabled both channels. The resulting graph, where both the separate channels and their corresponding signals were superimposed onto each other, can be seen below.

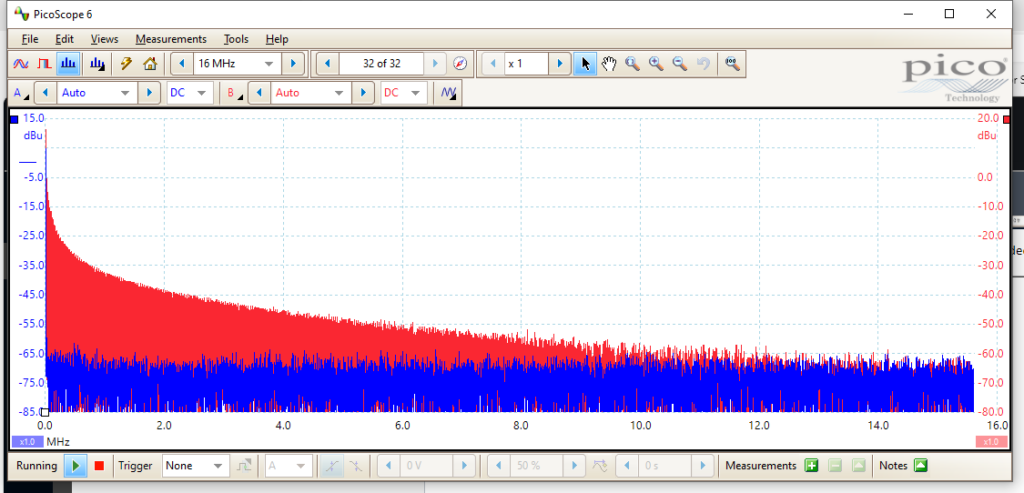
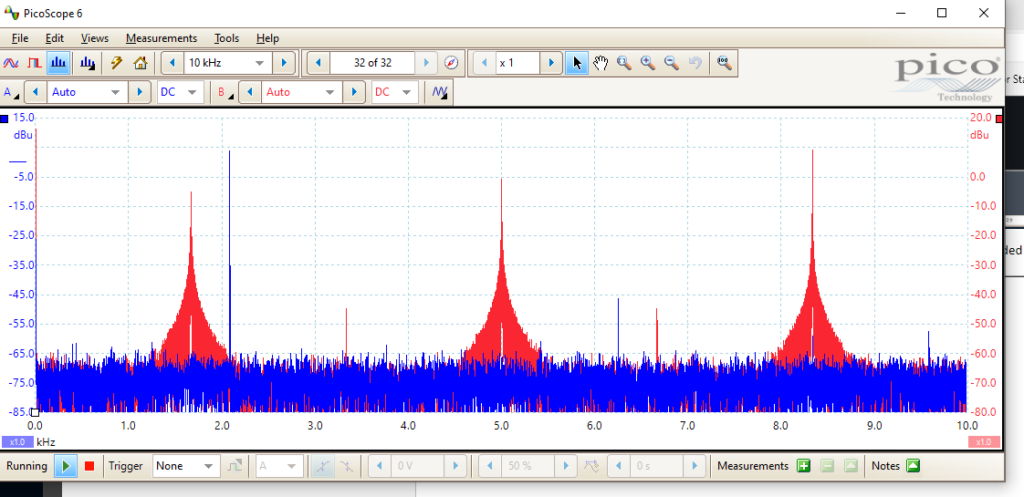
In step 5, we experimented with spectrum mode in order to analyze the signals as a function of frequency rather than time. Similar to time division in scope mode, we can choose a frequency range for our analysis in spectrum mode. We experimented with multiple ranges and the resulting spectrum graphs found can be seen below.


Part B: Triggering
When we analyze a signal using the Pico Scope, most of the time the signal is not going to have an integer number of wave lengths that corresponds to the horizontal scale of the signal on our workstation. This means that without triggering, the signal would appear to be jumping all over the place. In order to remedy this, we employ triggering. We set a trigger (or let the scope set one) so that each refresh will begin at the same amplitude and phase as the previous, eliminating the shuttering effect. There are multiple triggering modes available such as rising edge, falling edge, and auto that we can use to position a given signal to our liking.
Part C: TIMS S&S SFP
The S&S SFP is a computer program that can be used to produce a given signal with the TIMS. When a certain signal is loaded in the software, it is outputted from the PC-MODULES CONTROLLER. We connected this output to our Pico Scope so we could observe the signal produced. In the SFP software, when a different lab is selected and loaded onto the TIMS, we can see a depiction of the signal in ARB viewer, which displays what is being generated by the ARB1 and ARB2 outputs of the TIMs. After a few seconds the same signal is generated and recorded by the Pico Scope.
Part D: SFP Control of TRIPLE ADDER Gains
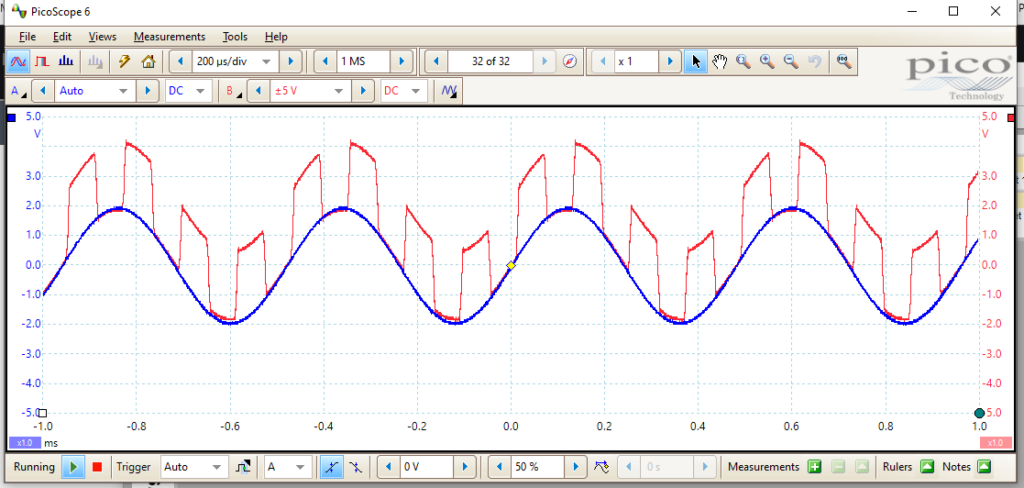
In this part of the lab, we explored the capabilities of the triple adder module that has variable computer-controlled amplifiers for each of its inputs. We began by connecting our 2kHz Message signal to the input of the adder and connecting the output and the input to our Pico Scope to compare. We can change the amplification via the S&S SFP software. When the amplification is off, we see that the two signals exactly align with each other. Then when we increase the amplification to 1.5x, we can see that the output is amplified relative to the input when comparing them on the Pico Scope. Next, we connected the 8.3 kHz clock signal to the other input of the adder. The amplifier was set to 1.0x (off) for the 2kHz signal and 0.5x for the clock signal. The signal was then compared to the 2kHz Message signal using the Pico Scope and the results can be seen below.

Conclusion
Overall, I enjoyed getting to experience a physical approach to signals and systems as opposed to a purely mathematical one. I think this helps the class feel more meaningful and helps me connect it back to my degree and career goals. While performing the lab, I was rather difficult to set the trigger point manually and to get the signals to scale the way I wanted. This was very finicky and I can tell it takes time to get a hang of. Overall, I think this lab was interesting and well written however for future students I think it would be helpful to connect these physical measurements and activities to the mathematical side of things.
Leave a Reply