Introduction
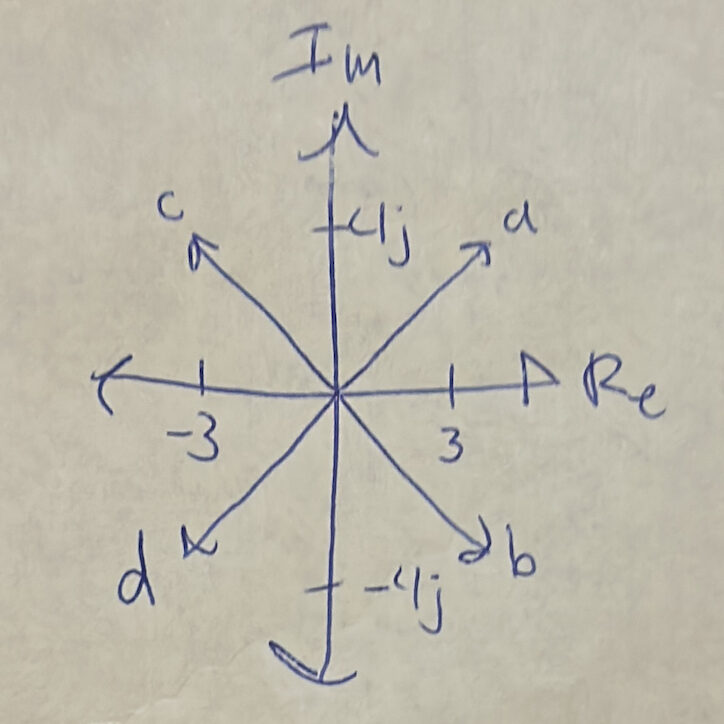
This lab focuses on understanding complex numbers and their practical applications in engineering and science. By exploring their rectangular and polar forms, using Euler’s equation, and working with tools like the TIMS rack and PicoScope, we’ll connect theoretical concepts to real-world signal analysis. Through exercises involving sinusoidal signals, phasor diagrams, and MATLAB programming, this lab aims to clarify the role of complex numbers in representing and analyzing physical systems, making their use more intuitive and relevant.
Procedure
Pre Lab

Part A
The experiment begins by connecting the Triple Adder to the TIMS system. ARB1 from the PC Modules Controller is linked to the f input of the Triple Adder and Scope Channel A, while ARB2 is connected to the g input and Scope Channel B. In the PicoScope software, Channel B is enabled, AC coupling is applied to both channels, the time scale is adjusted to 2 ms/div, and the trigger mode is set to auto. In the SFP interface, Lab 6 is selected, and the position of the Triple Adder is configured. ARB1 is programmed to output sin(t) with no phase offset, and ARB2 is set to sin(t+90), introducing a 90-degree phase shift. Adding the two signals as vectors, (1+0j) and (0+1j), gives a result of (1+1j), which corresponds to a magnitude of the square root of 2 at an angle of 45 degrees. After loading these configurations, the resulting signal is observed in the PicoScope. Finally, the ARB2 phase is altered to -90 degrees, and the system is reloaded to examine the new output which is (1-1j) or 2^(0.5) -45 degrees.
The PicoScope is configured to show both the output signals and an XY view of their interaction. Due to the signals being 90 degrees out of phase, the sinusoidal signal creates a circular trajectory, as seen below. This happens because the Y-axis represents the imaginary values, while the X-axis corresponds to the real values.
When ARB1 is disconnected from Scope Channel A, the real component is removed, and the XY plot displays a vertical line ranging from -1 to 1 on the Y-axis, representing oscillation between -1j and 1j. Reconnecting ARB1 and disconnecting ARB2 from Scope Channel B causes the XY plot to display a horizontal line spanning -1 to 1 on the X-axis, as the imaginary component is eliminated, leaving only the real values oscillating.

ARB2 is reconnected to Scope Channel B, and the SFP Triple Adder settings are adjusted. The reference amplitude for ARB1 is set to 1 with a phase of -15 degrees, while the reference amplitude for ARB2 is set to 1.1 with a phase of -75 degrees. Once these settings are configured, the ARB is loaded. The observed graph shows the resulting equations: 1cos(t – 15) for ARB1 and 1.2cos(t + 75) for ARB2. The resulting signals and the XY graph are shown below.

Part B
Matlab is now used to perform conversions between polar and rectangular coordinates. The Matlab functions required for these conversions are provided at the end of this lab report for download.
Part C
The amplitude of ARB1 is adjusted to 1 with a phase angle of -15 degrees, while ARB2 is set to an amplitude of 1.2 and a phase of 75 degrees. The f+g output is monitored using the scope, and the measured value is 1.523. Phasor calculations predict an amplitude of 1.5620 at an angle of 35.19 degrees.
Later, ARB1 is configured with an amplitude of 1 and a phase of 0 degrees, while ARB2’s amplitude is set to 1.2 with a phase of 180 degrees. After loading the ARB settings, the combined signal has an output of 0.2 at 180 degrees. When the phase of ARB2 is changed to -180 degrees, the output remains 0.2 at 180 degrees. This is because 180 degrees and -180 degrees are equivalent in phase, which is consistent with theoretical expectations.
Part D
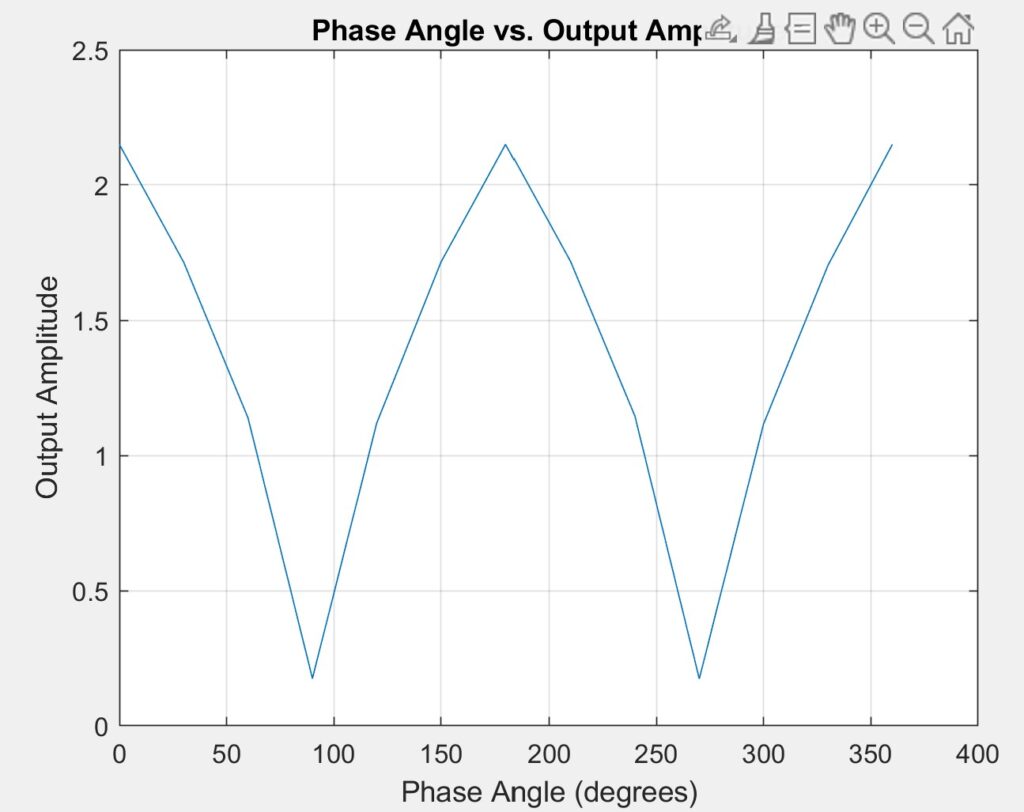
The TIMS setup remains the same as in the previous section. ARB1 is configured with an amplitude of 1, and ARB2 is set to an amplitude of 1 with a phase offset of 20 degrees. After enabling Conjugate Phase mode, the ARB phasor is adjusted in increments of 30 degrees, covering the full range from 0 to 360 degrees. The amplitude of each signal is measured during the process and recorded in Table 1. The data is then visualized in Matlab, with the resulting plot shown below.


Conclusion
In conclusion, this lab demonstrated how complex numbers can effectively represent and analyze sinusoidal signals in both mathematical and engineering contexts. By working with the TIMS rack, PicoScope, and MATLAB, we linked theoretical concepts like Euler’s equation and phasor diagrams to real-world applications. These hands-on exercises reinforced the importance of complex numbers in understanding and manipulating physical systems, solidifying their value as a key tool in engineering and science.
Leave a Reply